ANSWER:
Mass Spectrum:
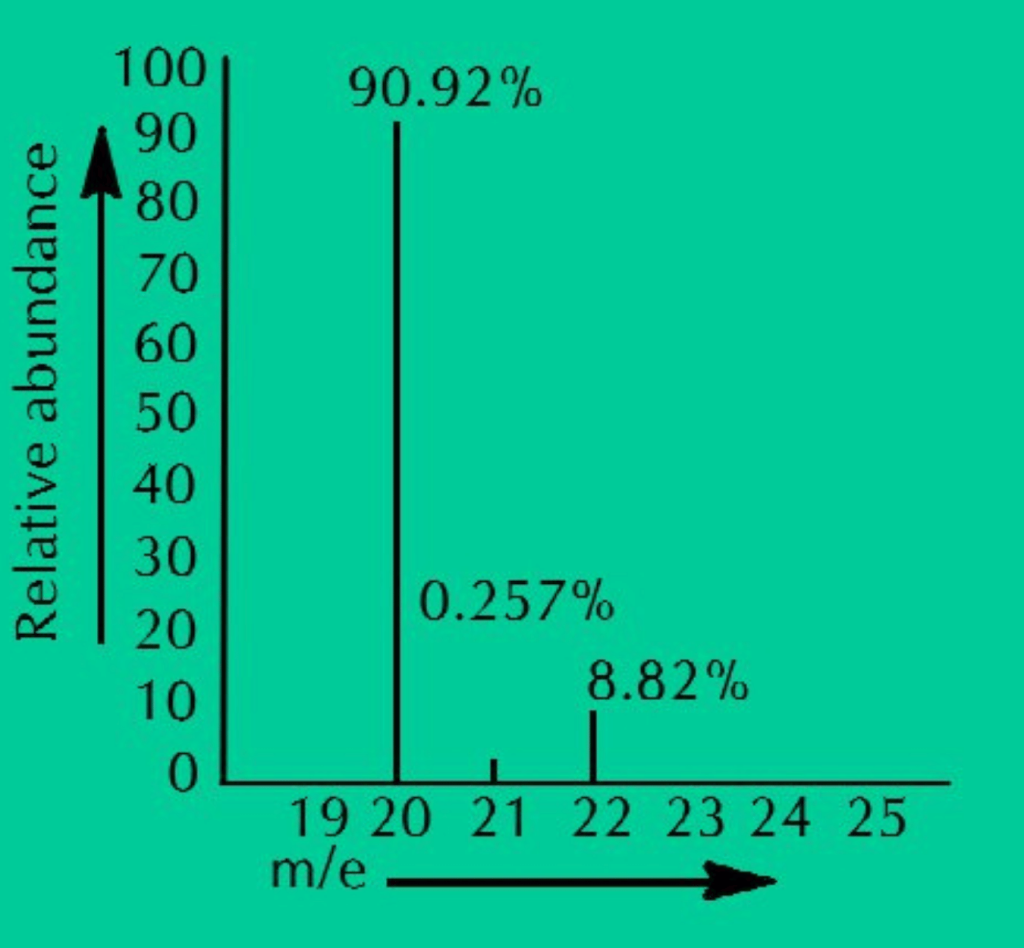
“Mass spectrum is a plot of data in such a way that m/e is plotted as abscissa (x-axis) and the relative number of ions as ordinate (y-axis).”
The number of peaks represents the number of isotopes while the heights of peaks reflect the percentage abundance of isotopes. Mass spectrum of Neon is shown in the figure.

(Ref. An Insight Into Objective Chemsitry-11, Ch-01, Q. No. 21)

